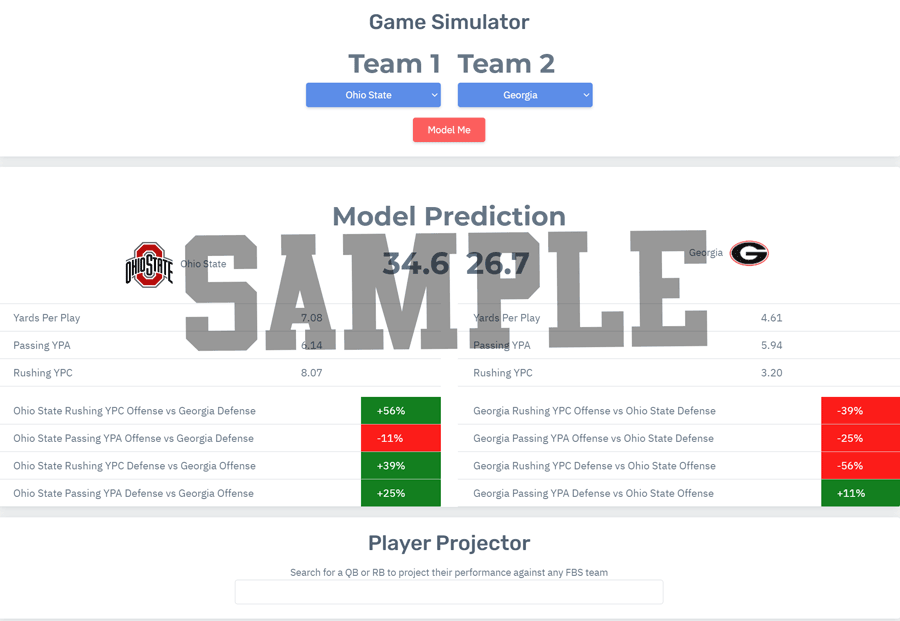
Game Simulator
The model reflects only in-season performance versus FBS teams. Teams playing very weak schedules are over-valued. The model will continue to be tweaked this season and is for informational/entertainment purposes only.
Team 1
Team 2
Player Projector
Search for a QB or RB to project their performance against any FBS teamCollege Football Nerds Game Model and Player Simulator
Model any two FBS teams against one another and see the same simulations we use on the show. Also project any QB or RB's estimated performance against any opponent based on both the player and team's averages